AdaptiveTrend by TrendPulse

Stop Guessing. Start Trading with Precision.

The only trading indicator that combines adaptive intelligence, 15 signal types, and gradient candle coloring into one powerful system. See what others can't. Trade with confidence.

AdaptiveTrend Chart Example
Get AdaptiveTrend Now

Why AdaptiveTrend Changes Everything

🎯

See Before Others Do

Stealth signals catch accumulation and distribution in grey (neutral) candles—before momentum indicators even wake up. Trade what the crowd can't see yet.

🎨

Gradient Intelligence

Every candle tells a story through 9 color levels. Four indicators (DSS, ADL, RSI, MACD) synthesized into one visual system. Know market strength at a glance.

15 Signal Types, One Chart

From stealth accumulation to explosive breakouts, trend changes to pullback entries—every market condition covered. No more switching between indicators.

🔄

Adaptive to Market Conditions

Automatically adjusts to volatility. Fast when markets trend, slow when they consolidate. Signals that matter, when they matter.

🔍

Scannable Everything

29 registered signals mean unlimited scan combinations. Build watchlists that find exactly the setups you trade. No more manual chart scrolling.

🎛️

Three Trading Styles

Aggressive for day traders, Normal for swing traders, Conservative for position traders. One indicator that adapts to you.

What You Get

Stealth Signals (NEW)

Catch moves before momentum indicators confirm

Primary Trend Changes

Never miss a major trend reversal

Explosive Breakouts

Happy/Angry Face signals for gap moves

Swing Trade Setups

Gradient color shifts with confirmation

Momentum Acceleration

4-pattern system catches explosive moves

Reversal Patterns

3R signals with hammer, doji, engulfing

Continuation Entries

Buy dips and sell bounces in trends

No Repainting

What you see is what you get, real-time

All Markets & Timeframes

Stocks, crypto, forex, futures—works everywhere

Contrary Candle Detection

Highlights when price fights indicators

Optional Volume Filter

Add OBV confirmation when needed

One-Click Setup

Default settings optimized and ready

Complete User Guide

🚀 Getting Started

Installation (TrendSpider)

  1. Open TrendSpider platform
  2. Navigate to the Indicator Library
  3. Search for "AdaptiveTrend by TrendPulse"
  4. Click "Add to Chart"
  5. Done! Default settings are optimized for immediate use

First Look

When you add AdaptiveTrend to your chart, you'll immediately notice:

  • Colored Candles: Each candle is colored based on market strength (9 gradient levels)
  • Signal Labels: Buy/Sell signals appear above or below candles
  • Clean Chart: No cluttered lines—everything you need is visual

💡 Pro Tip

Start with default settings for 1-2 weeks. Learn how the signals and colors behave in different market conditions before customizing.

🎨 Understanding the Gradient Candle System

The gradient system is the foundation of AdaptiveTrend. Every candle is colored based on the combined verdict of four technical indicators:

  • DSS (Double Smoothed Stochastic): Momentum direction
  • ADL (Accumulation/Distribution): Volume flow
  • RSI (Relative Strength Index): Overbought/oversold
  • MACD: Trend confirmation

The 9 Color Levels

Very Strong Bullish All 4 indicators + strong volume
Strong Bullish All 4 indicators positive
Moderate Bullish 3 out of 4 indicators positive
Weak Bullish 2 out of 4 indicators positive
Neutral Mixed signals, no clear direction
Weak Bearish 2 out of 4 indicators negative
Moderate Bearish 3 out of 4 indicators negative
Strong Bearish All 4 indicators negative
Very Strong Bearish All 4 indicators + strong volume
Contrary Candle Price fights 3 indicators (warning!)

🎯 How to Use Colors

Entry: Look for color transitions (grey → weak bullish → moderate bullish = momentum building)
Hold: Strong colors confirm trend strength
Exit: Color weakening (strong → moderate → weak = momentum fading)
Warning: Contrary candles often mark exhaustion or reversal points

📊 The 13 Signal Types

AdaptiveTrend provides 13 distinct signal types, each designed for specific market conditions. They're organized by priority—higher priority signals fire first.

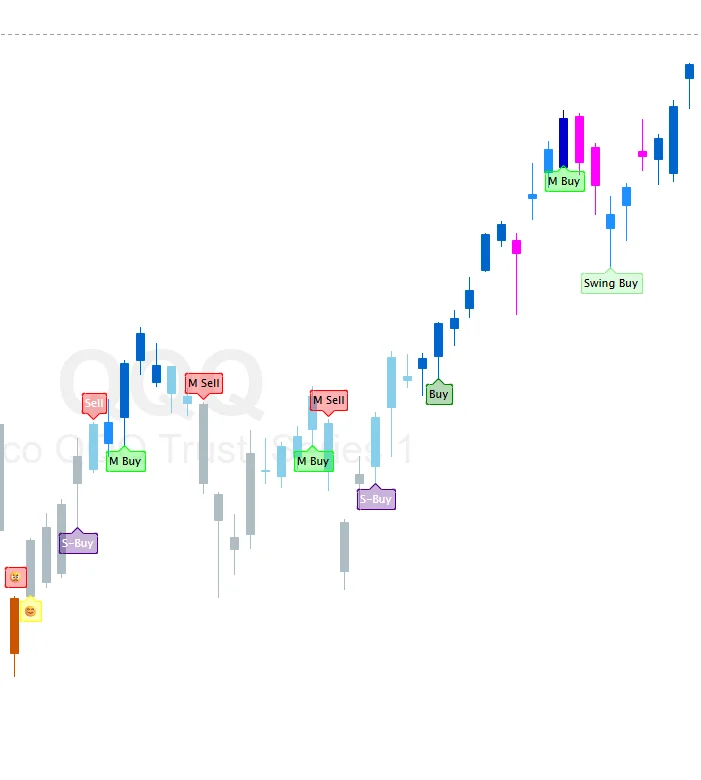
1. Stealth Buy (S-Buy)
Priority 1 - Buy Signal

Catches quiet accumulation before momentum indicators confirm. The ultimate early-entry signal.

When it fires: 3 consecutive grey (neutral) candles, each making a higher high. Current bar can be grey or bullish.
Use for:
• Catching moves before the crowd
• Low-risk entries in consolidation
• Building positions early
1. Stealth Sell (S-Sell)
Priority 1 - Sell Signal

Catches quiet distribution before breakdown. Exit before the crowd panics.

When it fires: 3 consecutive grey candles, each making a lower low. Current bar can be grey or bearish.
Use for:
• Early warning of weakness
• Taking profits before breakdown
• Tightening stops
2. Primary Buy
Priority 2 - Buy Signal

Major trend change signal. The classic "new uptrend starting" indicator.

When it fires: Fast KAMA crosses above slow KAMA (golden cross).
Use for:
• Catching major trend changes
• Position trading entries
• High-conviction setups
2. Primary Sell
Priority 2 - Sell Signal

Major trend change to downside. The "new downtrend starting" signal.

When it fires: Fast KAMA crosses below slow KAMA (death cross).
Use for:
• Exiting long positions
• Short entry opportunities
• Avoiding drawdowns
3. Happy Face (😊)
Priority 3 - Buy Signal

Explosive bullish breakout with gap up. Panic buying in progress.

When it fires: Price gaps up from below both MAs to above both MAs.
Use for:
• Explosive breakout plays
• Gap-up momentum
• High-volatility entries
3. Angry Face (😠)
Priority 3 - Sell Signal

Explosive bearish breakdown with gap down. Panic selling in progress.

When it fires: Price gaps down from above both MAs to below both MAs.
Use for:
• Quick exits
• Avoiding breakdowns
• Short opportunities
4. Swing Buy
Priority 4 - Buy Signal

Gradient color flip from bearish/neutral to bullish with KAMA32 confirmation.

When it fires: 2 bars bearish/neutral, current bar bullish, close above KAMA32.
Use for:
• Swing trade entries
• Multi-day holds
• Catching trend shifts
4. Swing Sell
Priority 4 - Sell Signal

Gradient color flip from bullish/neutral to bearish with KAMA32 confirmation.

When it fires: 2 bars bullish/neutral, current bar bearish, close below KAMA32.
Use for:
• Swing trade exits
• Trend reversal detection
• Taking profits
5. Momentum Buy (M Buy)
Priority 5 - Buy Signal

Acceleration within weak uptrends. 4-pattern system catches explosive moves.

When it fires: 2 bars weak/moderate bullish + one of 4 patterns:
• Simple higher high (most common)
• V-bottom with gap
• Engulfing after lower low
• Reversal candles (hammer, doji, etc.)
Use for:
• Acceleration plays
• Adding to positions
• Momentum breakouts
5. Momentum Sell (M Sell)
Priority 5 - Sell Signal

Momentum failure in weak uptrends. Warning of reversal.

When it fires: 2 bars weak/moderate bullish + one of 4 patterns:
• Simple lower low (momentum failure)
• V-top with gap
• Bearish engulfing
• Inverted hammer
Use for:
• Exiting weak trends
• Tightening stops
• Reversal warning
6. Reversal Buy (3R Buy)
Priority 6 - Buy Signal

Classic reversal patterns from bearish to bullish. High-probability setups.

When it fires: 2 bars bearish/neutral + reversal pattern + close above KAMA Long:
• V-bottom with gap up
• Engulfing after lower low
• Hammer, doji, marubozu patterns
Use for:
• Catching bottoms
• Reversal trading
• V-shaped recoveries
6. Reversal Sell (3R Sell)
Priority 6 - Sell Signal

Classic reversal patterns from bullish to bearish.

When it fires: 2 bars bullish/neutral + reversal pattern + close below KAMA Long:
• V-top with gap down
• Engulfing after higher high
• Inverted hammer pattern
Use for:
• Catching tops
• Reversal exits
• Short setups
7. Continuation Buy (C Buy)
Priority 7 - Buy Signal

Buy the dip in established uptrends. Pullback entry specialist.

When it fires: In uptrend (fast MA > slow MA), price dips below fast MA but stays above slow MA, then reclaims fast MA.
Use for:
• Buying dips
• Adding to winners
• Low-risk trend entries
7. Continuation Sell (C Sell)
Priority 7 - Sell Signal

Sell the bounce in established downtrends.

When it fires: In downtrend (fast MA < slow MA), price bounces above fast MA but stays below slow MA, then rejects back down.
Use for:
• Selling bounces
• Short entries in downtrends
• Taking profits on rallies

⚙️ Settings & Customization

Primary Buy/Sell (Dropdown)

Controls the timing of Primary Buy/Sell signals by adjusting KAMA crossover sensitivity.

Mode KAMA Periods Best For
Aggressive 10/13 (fast crossovers) Day trading, scalping, high-frequency
Normal 14/20 (balanced) Swing trading, most traders
Conservative 21/34 (slow, reliable) Position trading, long-term holds

Gradient Mode (Dropdown)

Controls how quickly candle colors change based on indicator periods.

Mode Indicator Periods Result
Aggressive 10-12 periods (fast) Colors change frequently, more gradient shifts
Normal 14-25 periods (balanced) Balanced color changes
Conservative 21-30 periods (slow) Colors change slowly, more reliable

Signal Toggles

Turn individual signal types on or off based on your trading style:

  • Day Traders: Enable S-Buy/Sell, M Buy/Sell, Happy/Angry Face, C Buy/Sell
  • Swing Traders: Enable Primary, Swing, 3R signals
  • Position Traders: Enable Primary, 3R, Swing signals only
  • Scanners: Enable specific signals you want to scan for

Use OBV Filter (Toggle)

When enabled, adds On-Balance Volume confirmation to signals.

  • OFF (default): More signals, faster entries
  • ON: Fewer signals, but with volume confirmation

Contrary Candle Color (Color Picker)

Customize the color for contrary candles (default: Magenta). These highlight when price action contradicts 3 out of 4 indicators—often marking exhaustion or reversal points.

🔍 Building Powerful Scans

AdaptiveTrend registers 29 different signals in TrendSpider, allowing you to build incredibly specific scans. Here are proven scan combinations:

Stealth Accumulation Scan

Stealth Buy Signal = TRUE

Finds: Stocks in quiet accumulation before momentum kicks in

High-Conviction Bullish Scan

(Strong Bullish OR Very Strong Bullish) = TRUE AND (Primary Buy Signal OR Swing Buy Signal) = TRUE

Finds: Strong momentum + confirmed trend change

Momentum Acceleration Scan

(Weak Bullish OR Moderate Bullish) = TRUE [Yesterday] AND Momentum Buy Signal = TRUE [Today]

Finds: Weak uptrends accelerating to strong momentum

Reversal Setup Scan

(Weak Bearish OR Moderate Bearish) = TRUE [2 days ago] AND Neutral = TRUE [Yesterday] AND (Weak Bullish OR Moderate Bullish OR Strong Bullish) = TRUE [Today]

Finds: Gradient flipping from bearish to bullish

Explosive Breakout Scan

Happy Face Signal = TRUE OR (Momentum Buy Signal = TRUE AND Strong Bullish = TRUE)

Finds: Gap-up breakouts or explosive momentum moves

Swing Trade Entry Scan

Swing Buy Signal = TRUE AND Close > KAMA 32

Finds: Multi-day swing trade setups with confirmation

💡 Scan Building Tips

• Start simple with 1-2 conditions, then add filters
• Use gradient colors to filter by trend strength
• Combine multiple signal types for high-conviction setups
• Save your best scans for daily watchlist building
• Backtest scan results to refine your edge

📈 Complete Trading Strategies

Strategy 1: The Stealth Accumulator (Day Trading)

Timeframe: 5-minute, 15-minute, or 1-hour charts

Entry:

  1. S-Buy signal fires (3 grey bars making higher highs)
  2. Wait for next candle to turn weak or moderate bullish
  3. Enter on the open of the bullish-colored candle

Stop Loss: Below the low of the S-Buy signal bar

Take Profit: When colors reach strong or very strong bullish, or when M Sell fires

Strategy 2: The Trend Rider (Swing Trading)

Timeframe: Daily charts

Entry:

  1. Primary Buy signal fires (KAMA golden cross)
  2. Wait for pullback (C Buy signal) or consolidation
  3. Enter on next strong bullish candle

Stop Loss: Below KAMA Long or Primary Sell signal

Take Profit: When Swing Sell fires or colors weaken to neutral/bearish

Strategy 3: The Reversal Specialist (Position Trading)

Timeframe: Daily or weekly charts

Entry:

  1. 3R Buy signal fires (reversal pattern)
  2. Confirm with gradient color flip to bullish
  3. Enter on close or next open

Stop Loss: Below the reversal pattern low

Take Profit: Primary Sell signal or 3R Sell signal

Strategy 4: The Momentum Scalper (Active Trading)

Timeframe: 1-minute, 5-minute charts

Entry:

  1. M Buy signal fires (Pattern 0: simple higher high)
  2. Candle color is moderate or strong bullish
  3. Enter immediately

Stop Loss: Tight stop below signal bar low (1-2% risk)

Take Profit: Quick profit target (0.5-1%) or when M Sell fires

⚠️ Risk Management Rules

• Never risk more than 1-2% of account per trade
• Use position sizing based on stop distance
• Always use stop losses—no exceptions
• Scale out of winners as colors weaken
• Don't trade against very strong opposite colors

❓ Frequently Asked Questions

Can I use AdaptiveTrend on crypto/forex/futures?

Yes! AdaptiveTrend works on any market and any timeframe. The adaptive intelligence adjusts to whatever you're trading.

Do the signals repaint?

No. AdaptiveTrend does not repaint. What you see is what you get. Signals fire in real-time and stay put.

Which signals should I enable?

Start with all signals enabled for 1-2 weeks. Then disable the ones that don't fit your trading style. Day traders typically focus on S-Buy/Sell, M Buy/Sell, and C Buy/Sell. Swing traders prefer Primary, Swing, and 3R signals.

Should I use the OBV filter?

Most traders leave it OFF for more signals. Turn it ON if you only want signals with volume confirmation. This reduces signal frequency but increases quality.

What's the difference between 3R and Momentum signals?

3R Buy requires previous bars to be bearish/neutral (catching reversals from downtrends). M Buy requires previous bars to be weak/moderate bullish (catching acceleration within uptrends). Same patterns, different contexts.

How do I know which settings mode to use?

Start with Normal. If signals are too slow, switch to Aggressive. If too noisy, switch to Conservative. The modes are designed for different trading speeds—not different skill levels.

Can I use just the gradient colors without signals?

Absolutely! Many traders use only the gradient coloring to gauge trend strength and make their own entry/exit decisions. Toggle off all signals and just trade the color transitions.

What are Contrary Candles good for?

Contrary candles (magenta) appear when price action contradicts 3 out of 4 indicators. They often mark exhaustion points, trend reversals, or areas where the market is "fighting" the underlying momentum. Use them as warnings, not as signals.

How many signals should I expect per day?

It depends on your settings and timeframe. On daily charts with Normal settings, expect 1-3 signals per week per stock. On 5-minute charts with Aggressive settings, expect 5-15 signals per day. S-Buy/Sell and M Buy/Sell are the most frequent.

💎 Pro Tips from the Experts

Tip #1: Layer Your Confirmations

Don't take signals in isolation. Look for confluence: S-Buy + weak bullish colors + close above support = high-probability setup. Multiple confirmations = higher win rate.

Tip #2: Trade with the Gradient

Only take buy signals when colors are neutral, weak bullish, or moderate bullish. Avoid buying into very strong bullish (often overbought). The best entries come as momentum is building, not when it's already exhausted.

Tip #3: Respect Contrary Candles

When you see a contrary candle (magenta) after a strong move, tighten your stops. These often mark short-term tops or bottoms. They're not signals to enter—they're signals to be cautious.

Tip #4: Use Multiple Timeframes

Check a higher timeframe for trend context. If the daily chart is strong bullish and the 15-minute chart gives an M Buy, that's a better setup than an M Buy on a daily bearish chart.

Tip #5: Build Your Signal Library

Screenshot every signal you take and note the outcome. After 50-100 trades, you'll see which signals work best for you, which timeframes, and which market conditions. Personalize the indicator to your edge.

Tip #6: Don't Chase

If you miss a signal, don't chase it. Wait for a pullback (C Buy) or the next signal. AdaptiveTrend generates plenty of opportunities—missing one is fine.

Tip #7: Combine with Price Action

AdaptiveTrend tells you WHEN and WHERE, but price action tells you HOW. Look at support/resistance, volume patterns, and candle formations alongside the signals for best results.

Ready to Transform Your Trading?

Join thousands of traders using AdaptiveTrend to trade with clarity, confidence, and precision.

Get AdaptiveTrend Now

Available exclusively on TrendSpider