PullbackPro
Detect optimal pullback opportunities within trending markets for low-risk entries
Detect optimal pullback opportunities within trending markets for low-risk entries
PullbackPro is a sophisticated technical indicator designed to automatically adjust to changing market conditions. Unlike traditional trend indicators that use fixed parameters, Adaptive Trend dynamically modifies its sensitivity based on market volatility.
This adaptive approach means you get relevant signals whether the market is trending strongly, moving sideways, or experiencing high volatility. The indicator helps you stay in profitable trends longer while getting out quickly when conditions change.
Identify optimal entry and exit points with precision, helping you maximize profits and minimize losses.
Clear visual signals eliminate guesswork, allowing you to make confident trading decisions quickly.
Adaptive algorithms filter out market noise, giving you high-probability trading opportunities.
Whether markets are trending or ranging, Adaptive Trend adjusts to provide relevant signals.
Learn how to get the most out of Adaptive Trend
Getting Started
Learn the basics of installing and setting up Adaptive Trend on TrendSpider
5:30Understanding Signals
Deep dive into how to interpret buy and sell signals for maximum profitability
8:45Advanced Strategies
Combine Adaptive Trend with other indicators for powerful trading strategies
12:20Real Examples
Watch live examples of Adaptive Trend in action on actual trades
15:10Everything you need to know about using Adaptive Trend
The indicator comes with optimized default settings that work well for most traders. However, you can customize:
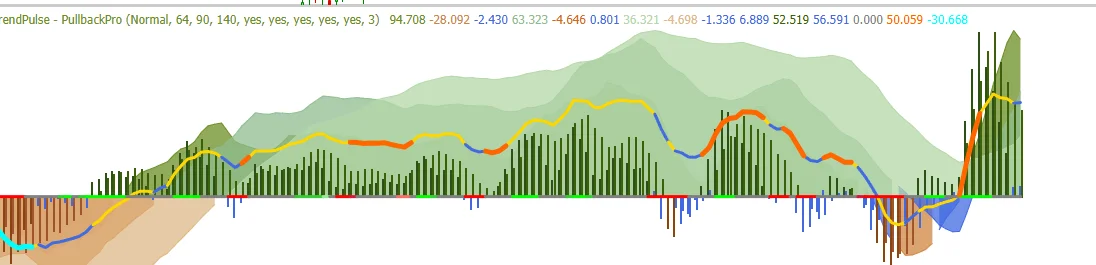
Adaptive Trend displays several key visual elements on your chart:
Adaptive Trend uses a proprietary algorithm that:
For Long Positions:
For Short Positions:
Adaptive Trend works exceptionally well when combined with:
For the best results:
Q: Why am I getting too many signals?
A: You may be trading on too low a timeframe. Try moving to a higher timeframe, or adjust the sensitivity setting to reduce noise.
Q: Can I use this for day trading?
A: Yes! Adaptive Trend works on all timeframes. For day trading, we recommend 5-minute to 15-minute charts.
Q: Does it repaint?
A: No, Adaptive Trend does not repaint. Once a signal is generated, it remains fixed.
Q: What markets does it work on?
A: Adaptive Trend works on all markets - stocks, forex, crypto, commodities, and futures.
Indicator not showing: Ensure you've added it to the chart and refresh your browser.
Colors not displaying: Check your chart theme settings and indicator color configuration.
Alerts not working: Verify alert settings in TrendSpider and check browser notification permissions.
Contact our support team at support@trendpulseindicators.com
Join thousands of traders using Adaptive Trend to make better trading decisions
Get PullbackPro NowSeamlessly integrates with TrendSpider